



Turn your field service data into decisions
Choose exactly which data you need — work orders, quotes, customers, objects — and OutSmart builds a clear report you can export to Excel in one click. Analyse trends, spot what's costing you, and share the numbers with your team in minutes, not hours.
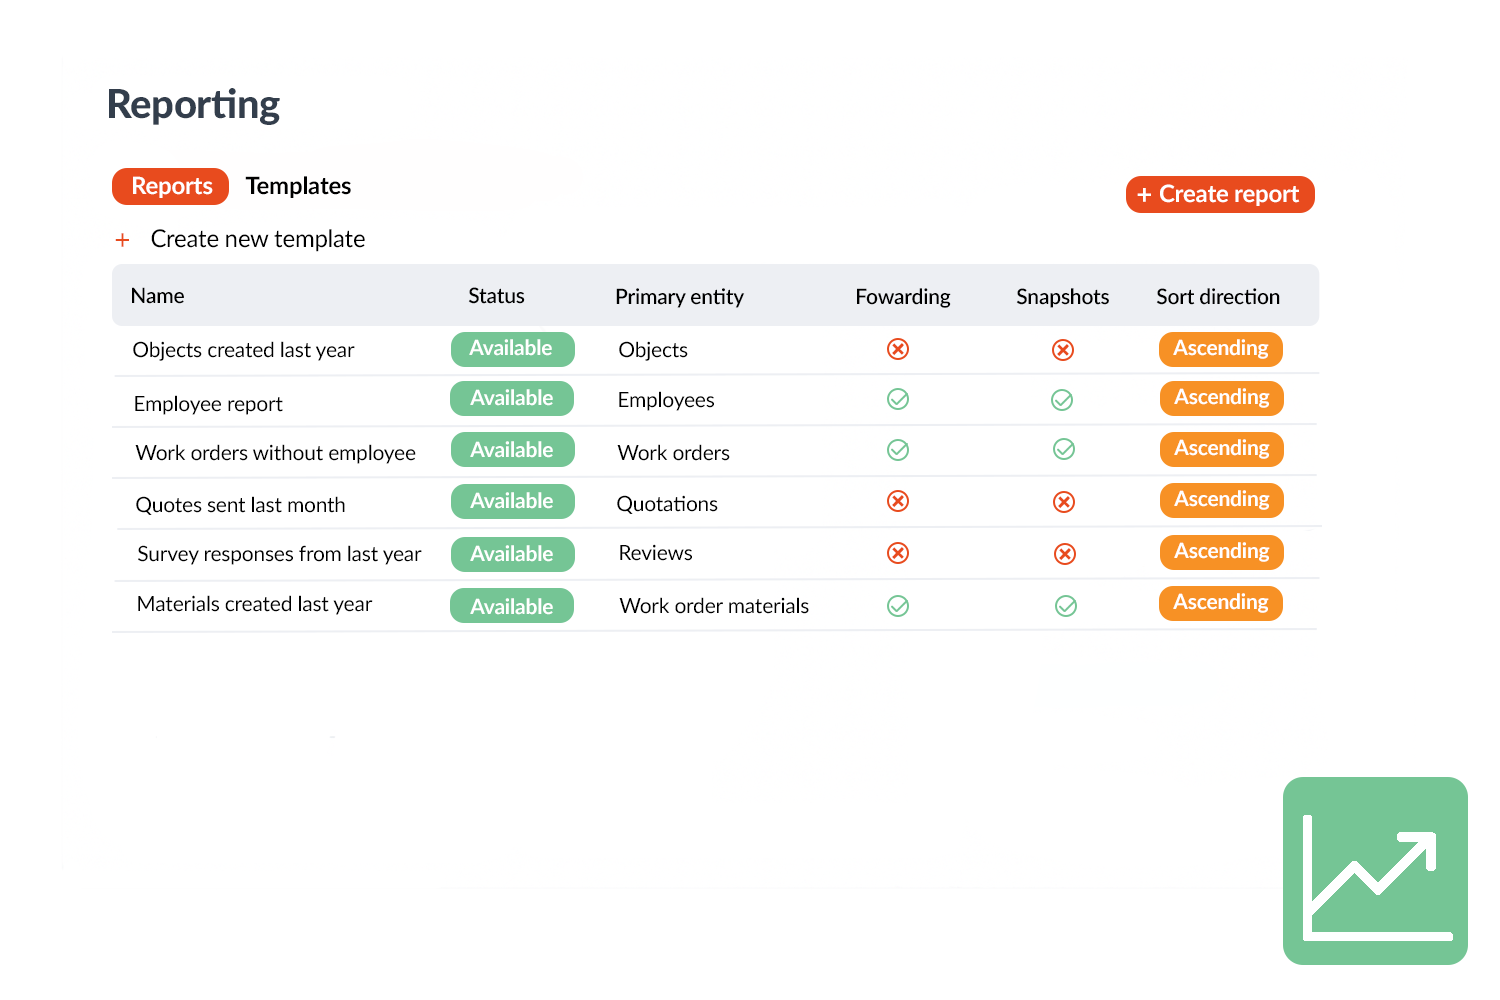
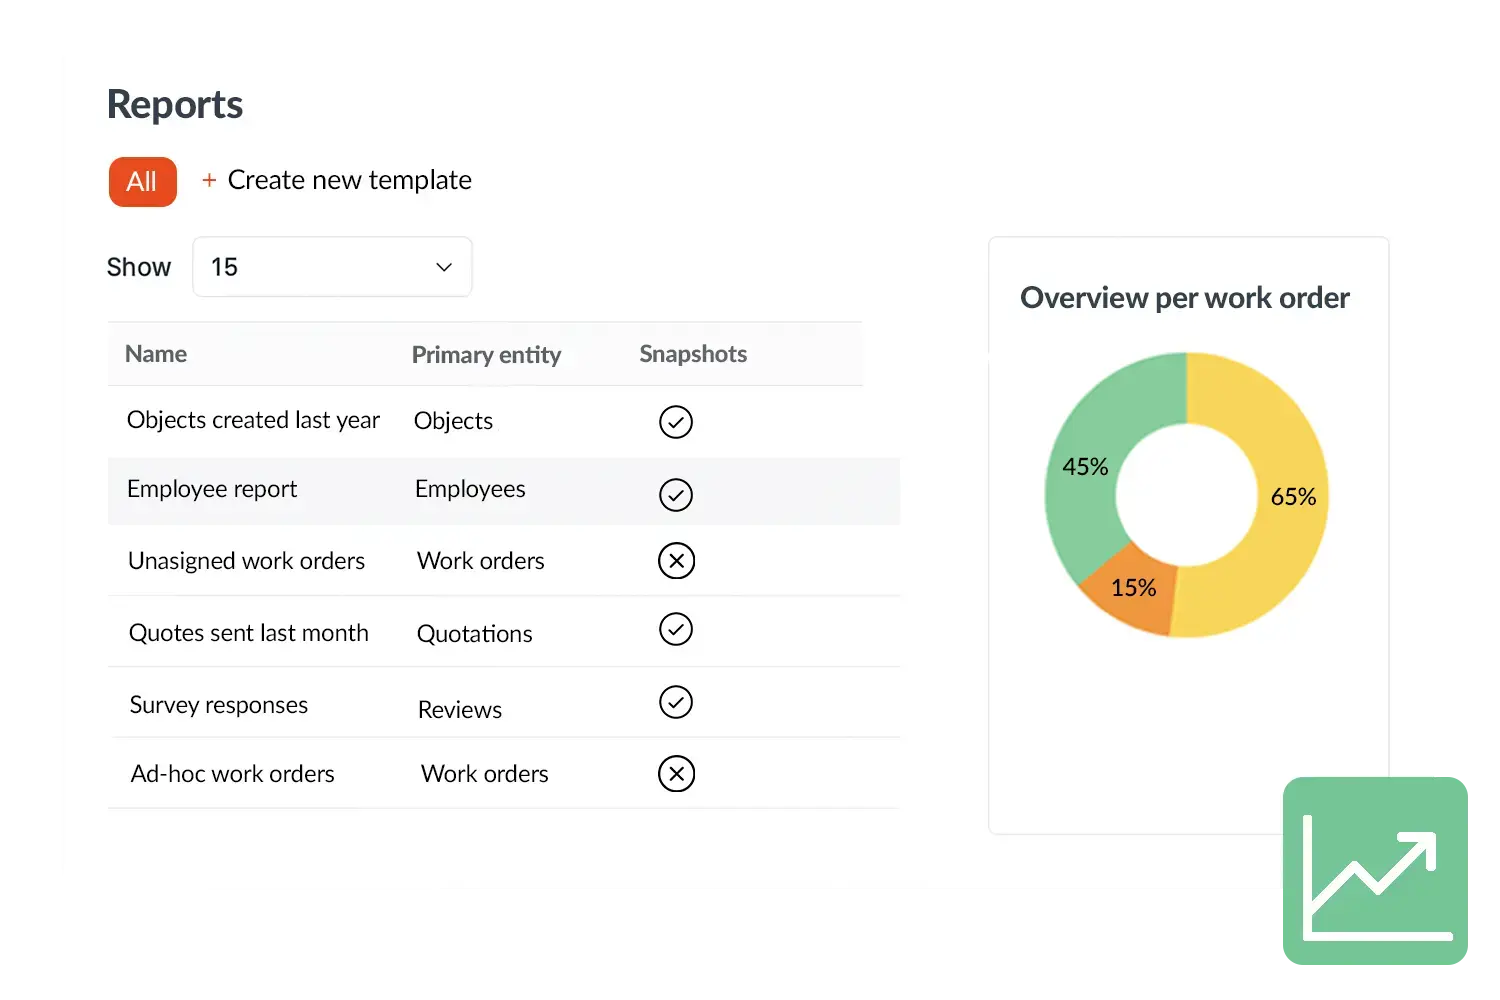
With Reporting in OutSmart you easily turn important data into clear reports. Think of work orders, quotations, relationships or objects: you choose which data you need and in what form you want to export it. OutSmart directly generates an Excel file so that you can further analyse or share the information with colleagues.
OutSmart Reporting is a real-time reporting module for field service managers. It turns operational data — job completion rates, technician utilisation, invoice totals, SLA performance, and material costs — into configurable reports and dashboards that update automatically. Managers get the insights they need without building spreadsheets or waiting for month-end exports.
Manual reporting vs. OutSmart Reporting
| Topic | Without OutSmart | With OutSmart |
|---|---|---|
| Data gathering | Export from multiple systems, merge manually in a spreadsheet | All operational data in one place — reports run instantly |
| Report frequency | Weekly or monthly — data always lags behind reality | Real-time — run a report for any period at any moment |
| KPI visibility | Calculated manually, different people get different numbers | Consistent KPIs from a single data source — no interpretation drift |
| Technician data | Estimated or compiled from timesheets and paper forms | Hours, jobs, travel, and materials per technician — live and accurate |
| Financial overview | Pulled from accounting software separately | Revenue, open invoices, and material costs visible in one report |
| Sharing reports | Exported to PDF or Excel, emailed manually | Shared directly from OutSmart or scheduled for automatic delivery |
In depth reports
Where Dashboards give you real‑time insight into the big picture, Reporting helps you dive into the details. This gives you grip on trends, performance and deviations. Whether it concerns hours, turnover or SLA agreements: with Reporting you always have the right figures to substantiate decisions.
Reporting makes your organisation data‑driven and gives you the tools to tackle improvement points concretely. From operational details to management information – you decide how deep you want to go. This way you always keep overview and control.
Practical example
A service company analyses with Reporting which work orders structurally cost more hours than planned. Based on these insights the planner adjusts the standard time in the planning board and future quotations are more realistic.
Benefits
- Direct exports to Excel – always ready for analysis
- Fully customisable – decide yourself which data you need
- Complement to dashboards – from main lines to details
- Better decisions – always backed by data
Work orders per year
Customers trust OutSmart
Years of experience
Frequently asked questions about OutSmart Reporting
OutSmart Reporting gives managers live access to operational KPIs including job completion rates, technician utilisation, average job duration, first-time fix rates, SLA compliance, invoice totals, material costs, and customer satisfaction scores — for any time period, filtered by team, region, or job type.
Yes. The reporting module supports configurable report types where you select the metrics, filters, and grouping that matter for your business. Reports can be saved and reused, so your standard weekly or monthly overview is always one click away.
Reporting data updates in real time as jobs are created, completed, and invoiced. There is no scheduled refresh or manual export needed — the figures reflect the current state of operations at the moment you run the report.
Yes. Reports can be scheduled to deliver automatically by email at a configured interval — daily, weekly, or monthly — to specific recipients. This is useful for management summaries, team performance overviews, or client-facing operational reports.
Yes. Per-technician reports show jobs completed, hours worked, travel time, materials used, first-time fix rate, and customer satisfaction score. Managers can identify high performers, spot training needs, and track utilisation without manual data gathering.
Yes. OutSmart has a native Power BI integration that sends data to Microsoft Power BI for custom dashboards and cross-system analysis. For companies that want to combine field service data with financial or HR data, Power BI provides a unified reporting environment.
Yes. Reports can be exported to PDF or Excel for sharing with stakeholders who do not have OutSmart access — such as board members, auditors, or clients. Scheduled email delivery can automate this for recurring reports.