OutSmart is gebruiksvriendelijk, compleet en gewoon makkelijk in gebruik. Voor ons dé tool die ik elke organisatie zou aanraden.
Kimberley, Oostendorp Nederland
With the Power BI Power-Up you link OutSmart to Microsoft Power BI, the leading platform for data visualization and reports. All data from OutSmart – from work orders and hours to quotes and invoices – become available in Power BI. This allows you to easily turn raw data into clear dashboards and reports.
OutSmart's Power BI integration connects your field service operational data directly to Microsoft Power BI, enabling managers to build custom dashboards, analyse trends, and track KPIs across technicians, job types, revenue, and client satisfaction — all from live data, without manual exports or spreadsheet consolidation.
| Step | Without OutSmart | With OutSmart |
|---|---|---|
| Data collection | Export CSV from each system, combine manually in Excel | Live data feed from OutSmart to Power BI — always up to date |
| Dashboard creation | Static charts in Excel, rebuilt each reporting period | Interactive Power BI dashboards, refreshed automatically |
| KPI tracking | Calculated manually per week or month | Real-time KPIs visible at any moment — no recalculation needed |
| Technician performance | Estimated from memory or periodic reviews | Per-technician metrics: jobs done, hours, travel, first-fix rate |
| Revenue analysis | Monthly, from accounting exports | Live revenue by job type, customer, region, or technician |
| Decision speed | Slow — insights lag behind operations by days or weeks | Immediate — act on yesterday's data, not last month's |
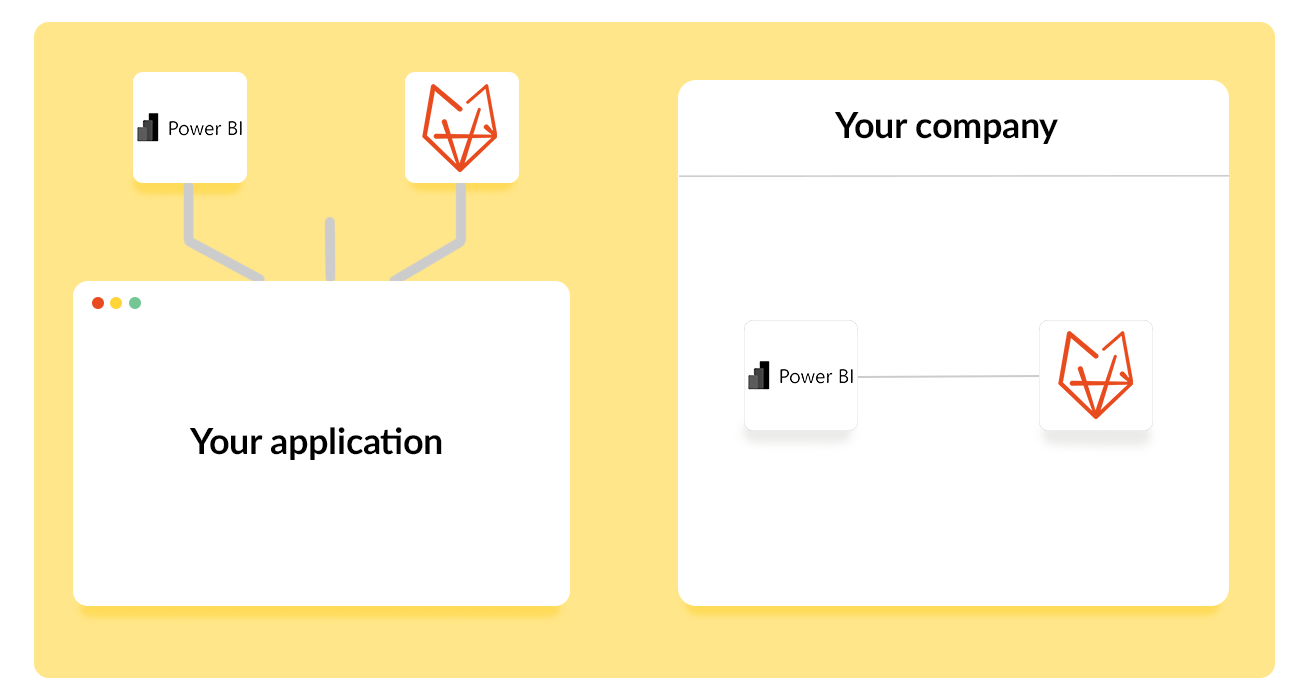
This link gives your organization deeper insights than the standard reports in OutSmart. You can analyze trends, monitor KPIs and combine data with information from other systems. This gives you a complete picture of your business operations and allows you to make better, substantiated decisions.
The possibilities are endless: insight into productivity per employee, revenue per customer group or the turnaround time of tasks. Everything is displayed visually and clearly, so that both management and operational teams can immediately work with the insights.
With Power BI you professionalize your business operations. You no longer work based on gut feeling, but steer by facts and current data. This makes your organization more agile, efficient and better prepared for growth.
A service company wanted better insight into the performance of their teams. With the link to Power BI they made dashboards showing productivity per technician, the average turnaround time of work orders and revenue by region. Thanks to these insights, they were able to plan more efficiently and significantly improve profitability.
Werkbonnen per jaar
Klanten vertrouwen op OutSmart
Jaren ervaring
OutSmart is gebruiksvriendelijk, compleet en gewoon makkelijk in gebruik. Voor ons dé tool die ik elke organisatie zou aanraden.
Kimberley, Oostendorp Nederland
OutSmart is zeer professioneel en onmisbaar in ons bedrijfsproces. Alle processen draaien nu veel efficiënter.
Twan van Horssen, Mobility Installations
OutSmart's Power BI integration sends your field service data — jobs, hours, materials, revenue, technician performance — directly to Microsoft Power BI in real time. Managers build custom dashboards that refresh automatically, replacing manual CSV exports and static Excel reports with live, interactive analytics.
You can connect any OutSmart data to Power BI: work order volumes, job durations, first-fix rates, travel times, material costs, invoice values, technician utilisation, client satisfaction scores, SLA compliance, and contract performance — across any time period or filter.
No. OutSmart provides a preconfigured connector that links to Power BI without custom development. Your IT team or a Power BI-literate manager can establish the connection in an afternoon. OutSmart's onboarding team supports the initial setup.
Data refreshes are configured based on your Power BI licence and reporting needs — typically every 15 minutes to a few hours for operational dashboards. This gives managers a near-real-time view of field operations without manual intervention.
Yes. Power BI is designed to combine multiple data sources. You can merge OutSmart operational data with financial data from Exact Online, HR data, or customer data from your CRM to build a unified business intelligence view.
The most common KPIs are: technician utilisation rate, first-time fix rate, average job duration, jobs per technician per day, invoice value per job type, SLA compliance percentage, open work order age, and revenue per customer segment.
The Power BI integration is available as an add-on to OutSmart's standard plan. Ask the OutSmart team during your demo to see which plan includes it and what dashboard templates are available out of the box.